———–
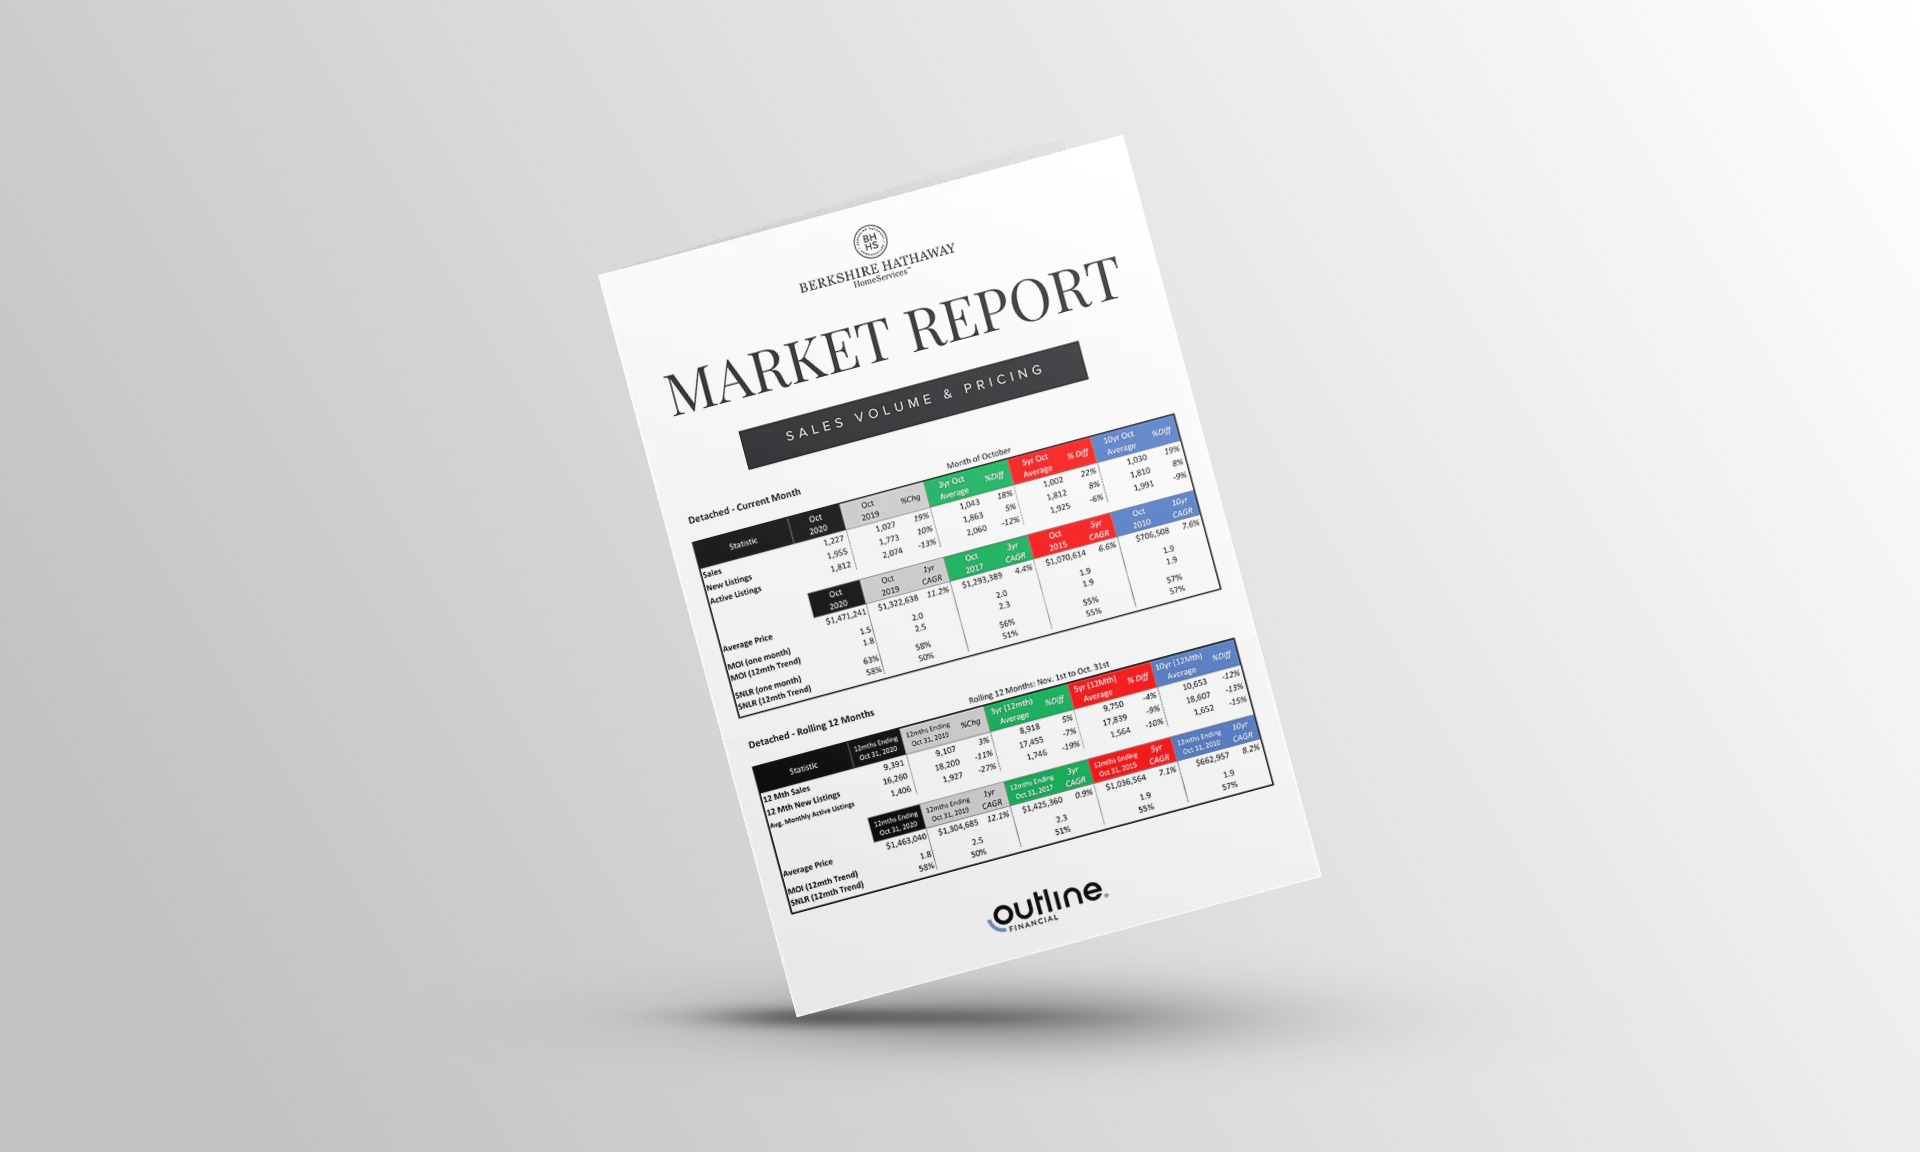
Each Executive Summary Report is for a specific TRREB zone combination and includes a map of the included zones and a 1 page summary for each property type (detached, semi-detached, townhomes, condos)
The Information / statistics you can find in each Executive Summary Report include:
- Data comparing the – 1, 3, 5 and 10 year sales averages.
- Stats categories – Sales, New Listings, Active Listings, Average Price, Months of Inventory (MOI), Sales to New Listing Ratio (SNLR)
Mortgage Updates
The Olympics are close and the TRREB market is on pace for a personal best. Given the torrid pace set at the beginning of the year, many believe a slow down is inevitable. The challenge will be identifying if (or when) a gradual slowdown transitions into a market correction.
So, how did the market fare in June? While no world records were set, June still clocked near record levels for the month. The media did a good job refraining from any “sky is falling” headlines leading with quotes such as:
- “Toronto’s Real Estate Market May Be Cooling, But it’s Still Red-Hot ” (Toronto Storeys)”
- “Toronto home sales and prices down in June, but TRREB still upgrades forecast ” (Globalnews)
- ”We have seen market activity transition from a record pace to a robust pace over the last three months.” (TRREB Market Watch Report – June 2021)
In this month’s edition of The Monthly Outline, we go beyond the headlines and explore the underlying data. What’s driving current market conditions and where do things go from here? In the Mortgage Outline section we analyze the recent Bank of Canada’s monetary policy and interest rate announcements (July 14th) to determine what it means for interest rates moving forward.
Looking for more information by specific property type or TRREB zone? Scroll to the bottom of this email for links to the Executive Summary, Power Pack, and Stats Outline reports for over 38 different TRREB zone combinations.
—
10 Year History of Sales and New Listings
Given seasonality trends, the month of June is typically slower than May. How did June 2021 shape up?
416 Sales / New Listings Summary
- There were 3,850 sales across all property types within the “416” TRREB zones. Up 37% vs. June 2020, +20% vs. the 5-year June average (3,209) and up +9% vs. the 10-year average (3,538).
- While sales were down vs. May, the sales-to-new listings ratio actually tightened in the month rising from 58% in May to 60% in June.
- Condos bucked the trend, with June sales increased June vs. May while new listings decreased from May to June. For full details by TRREB zone and property type, please visit the links a the bottom of this email.
—
905 Sales / New Listings Summary
- There were 7,253 sales across all property types within the “905” TRREB zones. Up 24% vs. June 2020, +27% vs. the 5-year June average (5,689) and up +17% vs. the 10-year average (6,183).
- Similar to “416”, while sales were down vs. May, the sales-to-new listings ratio actually tightened in the month rising from an already high 68% to a near record of 74%. This signals continued lack of supply vs. demand which should continue through the summer.
- Also similar to 416, 905 condo sales increased in June as compared to May.
Year-To-Date Sales & TRREB Revised Forecast
- TRREB posted a new sales record during the first 6 months of 2021 coming in at 70,133 (up 95% vs. the previous year, +43% vs. the 5-year average and +39% vs. the 10-year average) – chart is included below.
- With such a strong start to the year, TRREB updated its full year forecast and now predicts we will end the year with 115,000 sales which would be higher than the previous record from 2016.
- To read TRREB’s updated forecast, please click here: [TRREB Updated Market Forecast – 2021]
Average Price Taking The Summer Off
Overall, TRREB’s average price remained at a near record level coming in at $1,089,536 for the month (up +17.0% vs. June 2020). We have, however, started to see a levelling off over the past number of months as buyers/sellers try to determine our new normal.
With a longer term view in mind, the 3-year compound annual growth rate (CAGR) in average price was 10.5%, 5-year CAGR was 7.8%, and10-year CAGR was 8.7%.
With respect to property types, detached homes led the way with a year-over-year increase of 24.7% capping off a wild 12 months. While inventory levels remain low across the board, it will be interesting to see if the areas that have climbed the fastest/highest will be sustainable, or if we will see an eventual pull-back. Territory specific detached year-over-year average prices:
- Old City of Toronto (pre-amalgamation) Zones: $2,449,802 (+15.8%) “416” Zones Outside of Old City of Toronto: $1,490,293 (+11.3%)
- Halton: $1,564,585 (+28.9%)
- Peel: $1,351,550 (+26.8%)
- York: $1,538,058 (+20.2%)
- Simcoe: $892,736 (+31.5%)
- Durham: $1,020,270 (+35.5%)
*Old City of Toronto Zones Include: C01, C02, C03, C04, C08, C09, C10, W01, W02, E01, E02
*”416″ Zones Outside of Old City of Toronto Include: C06, C07, C11, C12, C13, C14, C15, W03, W04, W05, W06, W07, W08, W09, W10, E03, E04, E05, E06, E07, E08, E09, E10, E11
While detached/semi/townhome prices have skyrocketed over the past 12 months, condo prices remain relatively flat with pre-pandemic levels (and in fact, are still lower in the Old City of Toronto zones). We anticipate a slow shift in the medium term (6 to 12months) where condo average price will begin to outperform other property types as the economic reopening progresses forward, immigration starts to ramp up, downtown living & elevators become convenient again, and a potential reverse wave as people relocate back to the core.
Where do things go from here?
As we enter the summer months, we should expect to see a continued month-over-month slow down given typical seasonality (July is typically slower than June).
Key takeaway? Overall, inventory remains at near record low levels (i.e., “905” detached active listings are -54% below the 5year average for a June, and 416 is -32% below) . The only exception is “416” condos were inventory is slightly higher than the 5-year average, but absorption rates are picking up speed. If nothing changes over the summer months, we could see prices march upward again in the fall as the usual fall uptick in demand chases a limited supply of properties.
Mortgage Updates
Bank of Canada Interest Rate Update
On eight scheduled dates each year, the Bank of Canada issues a press release announcing its decision for the overnight rate target, together with a short explanation of the factors influencing the decision. This announcement can provide critical insight into the economy as well as the future timing and direction of fixed and variable mortgage rates. The most recent announcement was on July 14th and key quotes were as follows:
- “The global economy is recovering strongly….with continued progress on vaccinations” [however] ”COVID-19 variants is a growing concern, especially for regions where vaccination rates remain low.”
- “The Bank now expects GDP growth [in Canada] of around 6% in 2021 – a little slower than was expected in April – but has revised up its 2022 forecast to 4 1/2 percent and projects 3 1/4 percent growth in 2023.”
- “Housing market activity is expected to ease back from historical highs”
- “Employment has once again begun to rebound, and we expect the hardest-hit segments of the labour market to post strong gains as the economy re-opens.”
- “Inflation is likely to remain above 3 percent through the second half of this year [top of the 1-3 percent inflation control target] and ease back towards 2 percent in 2022.”
- “The Governing Council judges that the Canadian economy still has considerable excess capacity…We remain committed to holding the policy interest rate at the effective lower bound until economics slack is absorbed…”
- “In the Bank’s July projection, this happens sometime in the second half of 2022.”
Key takeaways? In summary, the Bank of Canada (BofC) reiterated its stance about an expected economic rebound but does hedge this statement with warnings about COVID-19 variants. The BofC also projects the housing market to ease back from historical highs. With respect to the impact on mortgage rates:
- Variable Rates – as variable rates are linked to a Lenders’/Banks’ Prime Lending rate, any interest rate movement by the Bank of Canada typically results in an immediate change to variable rates. Based on the most recent outlook, the BofC suggests the earliest it would increase its rate would be “the second half of 2022”. This is in line with their July monetary policy projections.
- Fixed Rates – fixed rates are based on the bond yield market (5yr fixed mortgages typically follow the Canada 5yr Bond Yields) which is the market’s view/prediction of where interest rates will be in the future. The July 14th announcement was generally in line with expectations which had minimal impact on yields. Fixed-rate mortgages look to have settled in at their current levels and we don’t anticipate any significant changes (up or down) in the near term.
For any mortgage related questions or requests, please contact any member of the Outline team as we are always on standby to help.
Market Report Downloads
| Executive Summary (5 Page Report) On the go? The Exec Summary Format provides 1yr/3yr/5yr/10yr comparisons across all key TRREB metrics in a “one-page-per-property” type layout. Details for the current month, year-to-date, and rolling 12-month totals and historical comparisons are also included. |
| NEW! Power Pack – 17 Page Report The latest (and we think greatest!) addition to the collection. This report includes everything from the Executive Summary Tables, plus some amazing charts/visuals for all major metrics including: sales, new listings, active listings, sales-to-new-listings ratio, months of inventory, average price, and sale price to list price. |